
Most "Taboola benchmarks" online are either Taboola's own averages or numbers from 2016. So we pulled our own: six Taboola accounts we manage for DTC brands in health and supplements, about $467,000 of spend, broken down by device and browser. The short version: smartphone clicks cost about 40% less than desktop and usually convert just as profitably, tablets convert three times worse than everything else, and the browser a click comes from changes the conversion rate by up to 15 times. Here are the numbers and what we do with them.
Where these numbers come from
- Accounts: six Taboola (Realize) accounts we manage as an official Taboola partner: a brand selling a health product for older adults in the US, Canada and Australia, a US health device brand and two US supplement brands. Clients stay anonymous.
- Period: the last 90 days (to 19 October 2026) for five accounts, the last 12 months for one supplement account.
- Spend: about $467,000 in total, around 945,000 clicks.
- Metrics: CPC, conversion rate (CVR, conversions divided by clicks) and ROAS (revenue divided by spend) as reported by the Taboola pixel in each account. They are not the numbers from the brands' attribution tools, which are usually lower.
CPA and ROAS depend on the product price, so don't copy our CPAs. What carries over from one account to another are the differences between devices and browsers, and those were remarkably consistent.
Taboola benchmarks by device
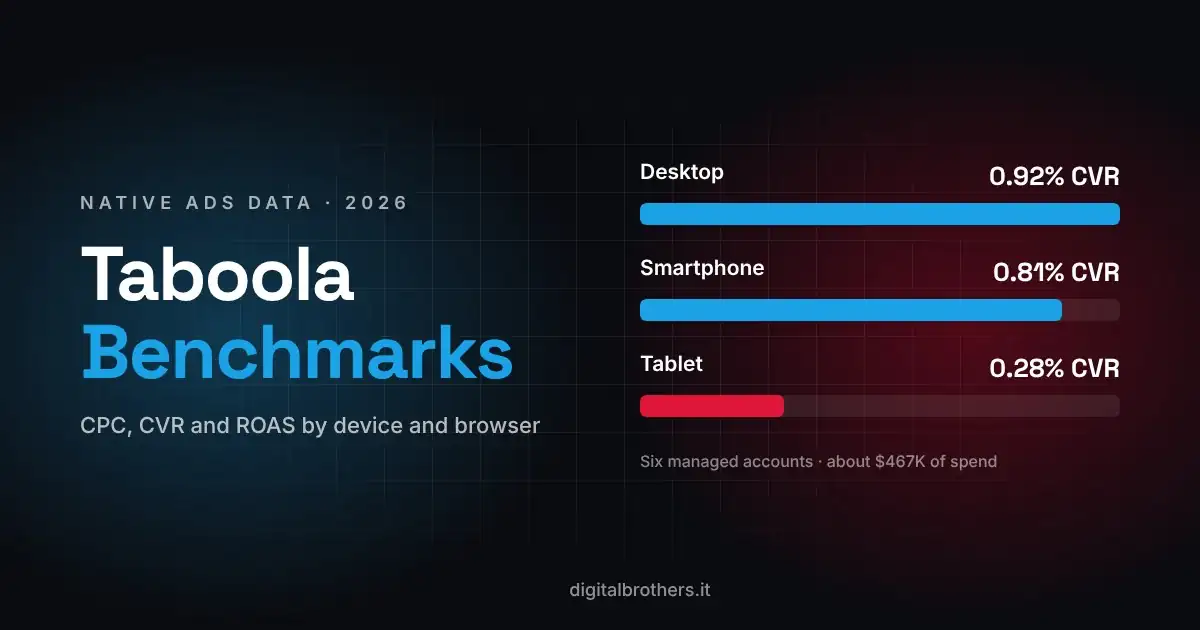
| Device | Share of spend | Avg. CPC | CVR | ROAS |
|---|---|---|---|---|
| Smartphone | 53% | $0.43 | 0.81% | 201% |
| Desktop | 39% | $0.73 | 0.92% | 198% |
| Tablet | 9% | $0.32 | 0.28% | 182% |
All six accounts combined, about $467,000 of spend.
Looking only at the five accounts on the 90-day window (about $233,000), the gap is even clearer: smartphone CPC $0.31 and ROAS 267%, desktop CPC $0.64 and ROAS 212%, tablet CVR 0.24% and ROAS 178%.
Smartphone: cheaper clicks, same or better return
Mobile clicks cost about 40% less than desktop in our accounts, and up to 50% less in the US. Conversion rate is a bit lower, but the cheaper click more than makes up for it: in four of the six accounts, mobile had the best ROAS of the three devices. The best example is a US supplement brand: 1.47% CVR and 286% ROAS on smartphone, against 0.95% and 95% on desktop.
The exception is a market where the funnel isn't built for mobile yet. On our new Canadian account for the older-adults health product, mobile spent $364 without a sale while desktop carried the account. So mobile is not automatically better: it's better when the advertorial and the checkout work on a phone.
Desktop: higher CPC, still the base for older audiences
Desktop CPCs ran from $0.51 to $1.01 per click depending on the account and country. For the health product aimed at older adults, desktop was 50% of US spend at 243% ROAS, and almost all of the spend in Canada and Australia. If your buyers are 55+, expect desktop to matter more than the "mobile first" advice suggests.
Tablet: the weakest device in four accounts out of six
Tablet CVR was 0.22% to 0.24% in four accounts, against 0.33% to 1.77% on desktop and smartphone. Clicks are cheap, so the damage is smaller than it looks, but in two accounts tablet ROAS was less than half of smartphone ROAS. The exceptions: a supplement account where tablets took less than 1% of spend and converted well, and the Canadian account, where smartphone was even weaker.
What we do: we never mix tablet into a desktop or smartphone campaign. We either run it as its own small campaign with its own budget and cut it if it doesn't reach the target CPA, or we leave it out at launch and test it once the main campaigns are profitable.
Taboola benchmarks by browser
This is the breakdown almost nobody looks at, and it is where we found the biggest differences. Data from the three largest accounts (about $444,000 of spend):
| Browser | Avg. CPC | CVR | ROAS |
|---|---|---|---|
| Facebook in-app browser | $0.60 | 2.20% | 387% |
| Android app | $0.42 | 0.99% | 236% |
| Chrome | $0.67 | 1.09% | 210% |
| Edge | $0.70 | 0.80% | 183% |
| Chromium | $0.44 | 0.70% | 175% |
| Safari | $0.37 | 0.27% | 132% |
| Firefox | $0.65 | 0.43% | 130% |
| WebView | $0.22 | 0.14% | 100% |
WebView: the cheapest clicks are the most expensive
WebView is a page opened inside another app instead of a real browser. In all three accounts it had the cheapest CPC and the lowest conversion rate: 0.11%, 0.12% and 0.26%, against 0.54% to 1.66% on Chrome. Its ROAS was 69% to 127%, half of Chrome or less. Because the clicks are so cheap, WebView can take a large share of clicks without you noticing: on one account it brought 23% of clicks and 11% of spend.
Low CVR alone doesn't prove the traffic is fake. Part of it is people who tap by mistake and close the app. But for a direct response funnel the result is the same: you pay for visits that don't buy.
Facebook in-app browser and Android apps: the surprise winners
Readers who reach Taboola placements from the Facebook app converted best in all three accounts: 0.63%, 2.35% and 3.28% CVR, with ROAS between 324% and 597%. Android app traffic was also strong, 190% to 467% ROAS. Our explanation is that these are people already reading articles inside an app, so the step from a news story to an advertorial feels natural.
Safari: probably undercounted, not just weak
Safari showed a low CVR in all three accounts (0.24% to 0.34%) and ROAS between 68% and 181%. Part of this is real, but part is tracking: Safari limits cookies, so the Taboola pixel misses some conversions that do happen. Before you cut Safari, compare it with your shop's own data (Shopify or your attribution tool). We lower bids on Safari only when both sources agree that it's weak.
New browsers that burn budget
Watch for browsers you don't recognise in the breakdown. On our Canadian account, a browser called Wave Browser spent $360 in two days for three conversions and used up the daily budget. The fix: clone the campaign without that browser and run it on a whitelist of 50 to 80 proven sites. Check the browser breakdown at least once a week, especially after a sudden drop in performance.
Same product, three countries
The brand selling the health product for older adults runs the same funnel in three markets, which makes for a clean comparison (last 90 days):
| Country | Spend | Avg. CPC | CVR | ROAS |
|---|---|---|---|---|
| United States | $161,000 | $0.44 | 0.40% | 240% |
| Canada | $7,900 | $0.56 | 0.33% | 156% |
| Australia | $6,600 | $0.84 | 0.52% | 160% |
Australia converts best but has the most expensive clicks, partly because of a few sites with unusual CPCs of $1.60 to $2.70 that we escalated to Taboola. Canada and Australia are younger accounts with smaller budgets, so the US numbers reflect a campaign that has had more time to learn. In our accounts, CPCs in Italy are several times lower than in the US, which is why the same product can work at a much lower price point there.
What we do with these numbers
- Separate campaigns by device. Desktop, smartphone and tablet each get their own campaign and budget, so one device can't hide the losses of another.
- Judge mobile on ROAS, not CVR. A lower conversion rate with a 40–50% cheaper click is often the most profitable traffic in the account.
- Treat tablet as a test. Small budget, its own target CPA, cut fast if it doesn't get there.
- Check the browser breakdown weekly. Lower bids or exclude WebView when it doesn't convert, and block unknown browsers that spend without converting.
- Confirm with your own data before cutting Safari. The pixel undercounts it.
- Compare countries on ROAS, not CPC. The most expensive click can be the most profitable one.
For budgets, see how much native ads cost or use our native ads budget calculator. If you're still choosing a platform, read Taboola vs Outbrain.
Frequently asked questions
What is a good CTR on Taboola?
In our accounts CTR ran from about 0.15% to 0.8% depending on device: highest on smartphone (around 0.5% to 0.8%), lowest on desktop (0.15% to 0.4%). CTR alone says little; a very high CTR with no conversions is often a sign of low-quality placements.
What is the average CPC on Taboola in the US?
In our US health and supplement accounts, average CPC was about $0.31 on smartphone and $0.63 on desktop over the last 90 days. It changes with vertical, country, bid strategy and competition, so treat it as a range, not a price.
What conversion rate should I expect from Taboola traffic?
For a purchase on a DTC funnel with an advertorial, we see roughly 0.3% to 1.2% of clicks converting across an account, and up to 1.7% on the best device, depending on product and price. Facebook in-app and Android app traffic converted best, WebView and tablet worst.
Should I exclude tablets on Taboola?
Not blindly. Tablets were the weakest device in four of our six accounts, but they still made money in some. Run them in a separate campaign with a small budget and cut them if they miss your target CPA.
Is mobile or desktop better on Taboola?
In most of our accounts, mobile had the better ROAS because clicks cost 40–50% less. Desktop stays important for older audiences. Test both in separate campaigns and let ROAS decide.
Want this analysis on your own account?
We are an official Taboola partner and manage native campaigns for DTC and lead gen brands worldwide. See how we work on our Taboola partner page, or book a free strategy call and we'll look at your device and browser breakdown together.

Claudio Dell'Ariccia
Co-founder & Media Buyer
Claudio Dell'Ariccia is co-founder of Digital Brothers. He runs native ad campaigns on Taboola, Outbrain and MGID every day for e-commerce, lead gen and affiliate brands worldwide.
About Digital Brothers →